Wick Analytics
Market Structure • Liquidity • CyclesCrypto Trader & Market Analyst Since 2019Identifying high-probability opportunities through structure, liquidity, and cycle analysis.Not Financial Advice.
Follow on X: https://x.com/Wick_BTC
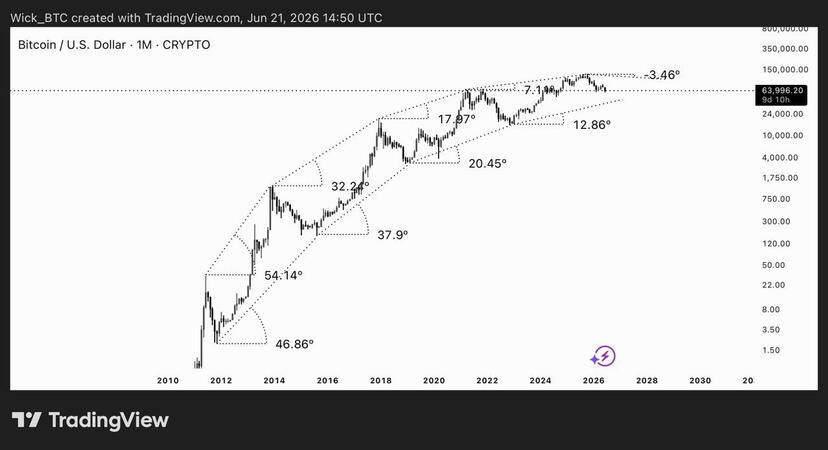
$BTC Cycles & Trend anglesBitcoin has followed a pattern of progressively declining trend angles throughout its entire history.From over 50° in the early cycles to nearly flat today, each expansion phase has shown less momentum than the previous one. The current structure is now approaching a point where the long-term trend angle is close to turning negative.This is why I believe the market may be entering a period of major cycle transition.Based on this model, even if a new bullish phase were to begin now, Bitcoin would struggle to produce a meaningful new all-time high. The historical trend suggests that each cycle is expanding with less strength, and the market may be moving from exponential growth into a much slower long-term structure.If this pattern remains valid, the coming years could look very different from what most participants have experienced in previous Bitcoin cycles.
▂▂▂▂▂▂▂▂▂▂▂▂▂▂▂▂▂▂▂▂
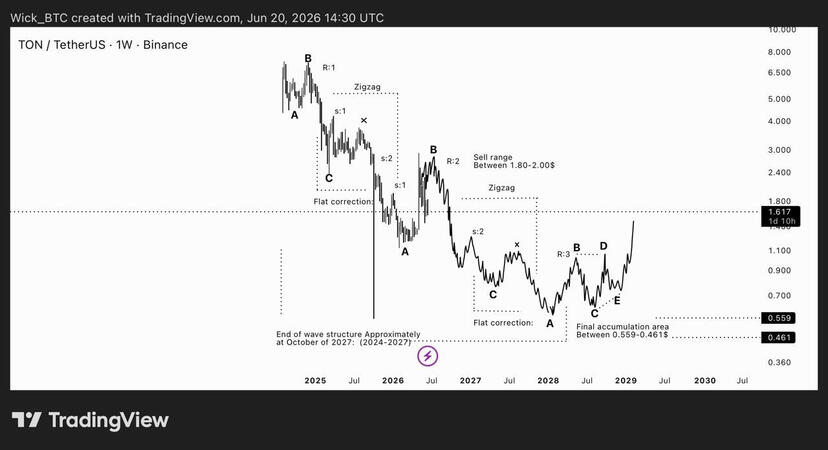
$TON (1W)Current wave count suggests the market is progressing through a larger corrective structure.Key levels:•Sell/Distribution: $1.80–$2.00
•Intermediate corrective swings through 2027–2028
•Final accumulation range: $0.559–$0.461
▂▂▂▂▂▂▂▂▂▂▂▂▂▂▂▂▂▂▂▂
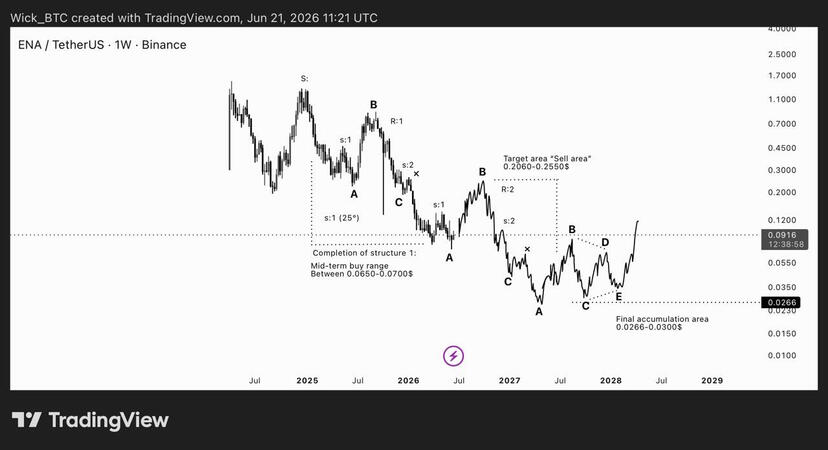
$ENA (1W) — Buy & Sell setup:My current ENA outlook suggests a relief rally is likely before the larger cycle fully completes.Accumulation around $0.065–0.070 offers favorable risk/reward, with a projected rally into $0.206–0.255 as the main sell zone.
If a deeper reset occurs, the final long-term accumulation area remains $0.0266–0.0300.
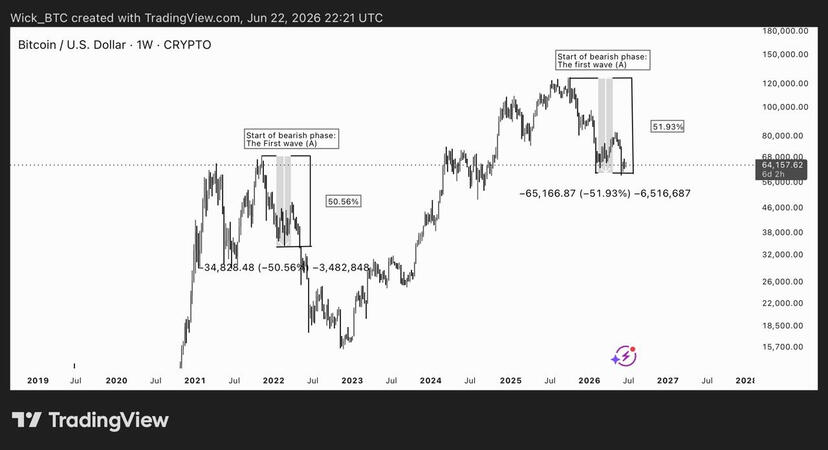
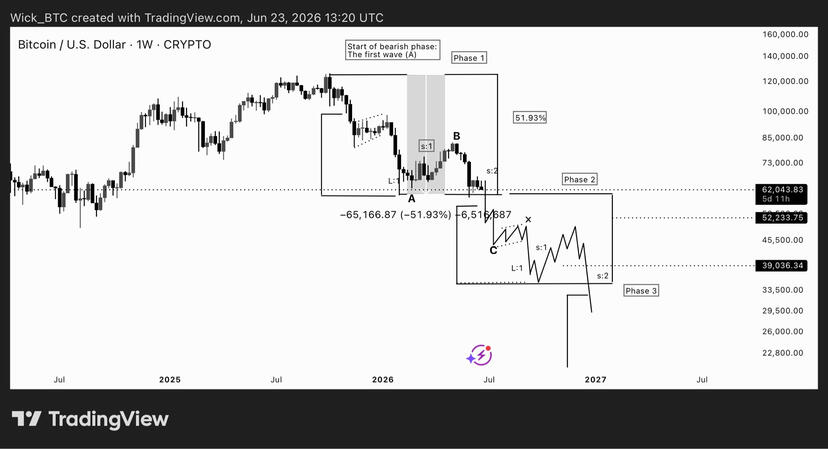
$BTCLook at this chart carefully, and you’ll understand why I believe Bitcoin is still in the early stages of its correction.Many traders believe the bottom is already in, or that the final low will be somewhere around $52,000. However, I still hold a different view.The decline we’ve seen so far appears to resemble only the first bearish wave (Wave A) of a much larger corrective structure. Historically, Bitcoin has often experienced an initial decline before entering a deeper and more prolonged correction.Based on this comparison, I believe the main correction has not started yet. Current price action may simply be the opening phase of a larger bearish cycle that could unfold over the coming years.For now, I remain cautious and continue to view rallies as temporary until the broader structure is invalidated. While many believe the worst is already behind us, my analysis suggests that the market may still have a significant correction ahead.
▂▂▂▂▂▂▂▂▂▂▂▂▂▂▂▂▂▂▂▂
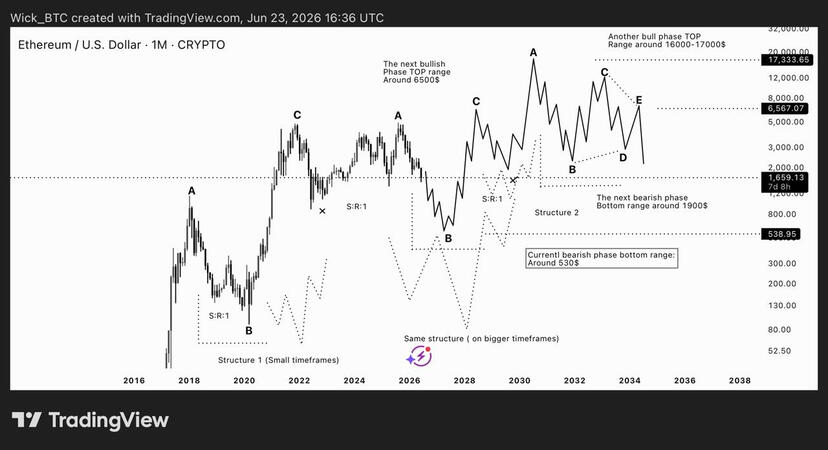
$ETH update:Ethereum appears to be developing a structure similar to Bitcoin’s macro cycle.My analysis suggests that major market structures often begin on smaller timeframes before expanding into a much larger picture. What initially looks like a local correction or accumulation phase can eventually evolve into a multi-year pattern on higher timeframes.In this scenario, Ethereum may be following the same path: first forming the structure on smaller scales, then gradually revealing the larger cycle. If this thesis is correct, the current bearish phase is only part of a broader development, with the possibility of deeper corrections before the next major expansion phase begins.The key idea is simple: small-timeframe structures often become the blueprint for larger-timeframe market cycles. Bitcoin has shown this behavior in the past, and Ethereum may now be developing a similar fractal pattern on a bigger scale.
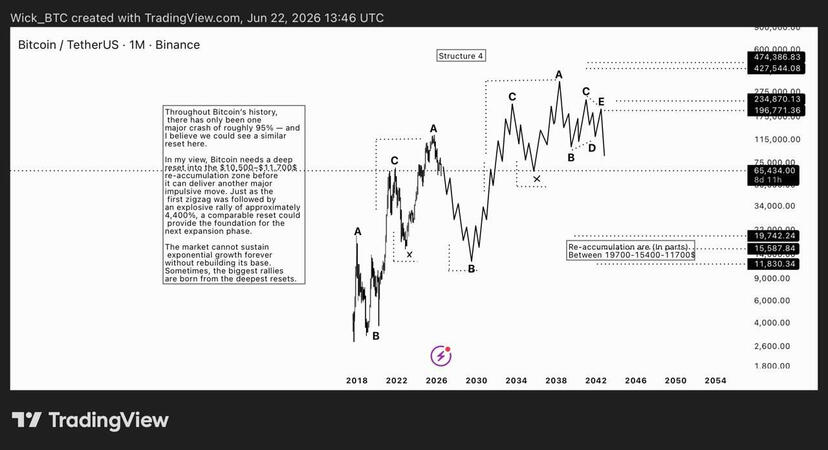
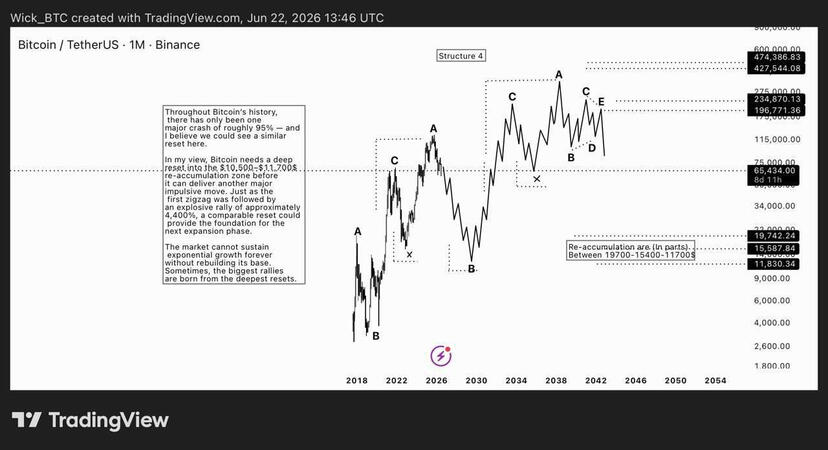
$BTC Final overview:The movement of the Bitcoin price seems to follow a recurring fractal pattern. Structures that first form on smaller time intervals gradually expand and reappear on larger time intervals, maintaining the same market character.Instead of focusing solely on price targets, this model examines the behavior of accumulation, expansion, distribution, and correction. The same sequence has been repeated multiple times throughout the history of Bitcoin, with each cycle unfolding on a larger scale than the previous one.If this fractal continues to develop, then the current market may still be following a plan set by earlier structures, which suggests that larger-scale phases of correction and re-accumulation may occur before the next long-term expansion cycle begins.As a result, my long-term re-accumulation targets remain below $19,000, with key zones at $15,400, and $11,700. These levels remain valid unless the market proves otherwise.
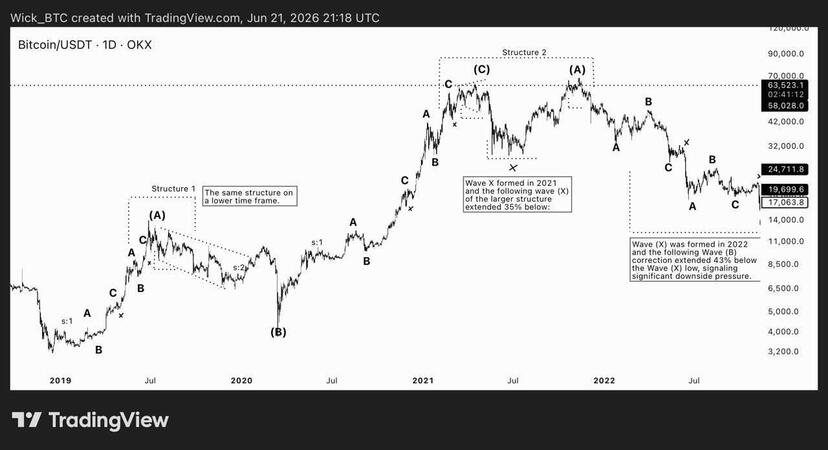
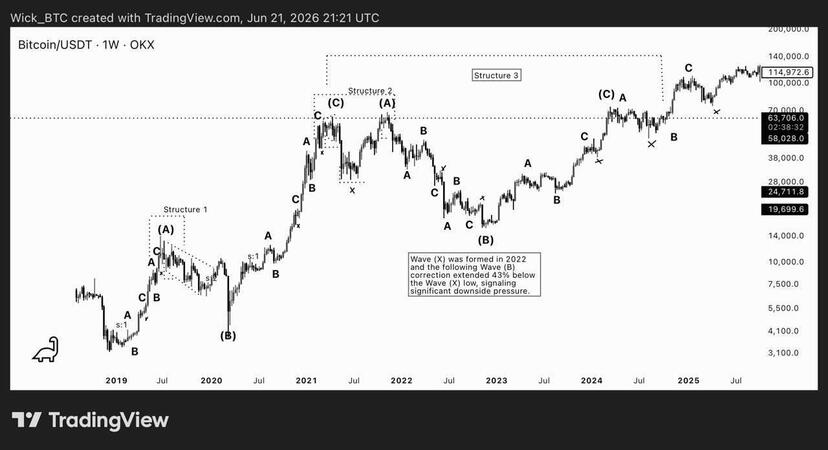
$BTC (1D)In my view, Bitcoin has just completed Phase 1 of its correction. While many market participants believe the bottom is already in, I believe the broader corrective structure is still unfolding.Phase 1 is complete, but two more corrective phases may still lie ahead before a true long-term bottom is established.The most significant reset of this cycle may still be ahead, and patience will be key as the market works through the remaining stages of the correction.
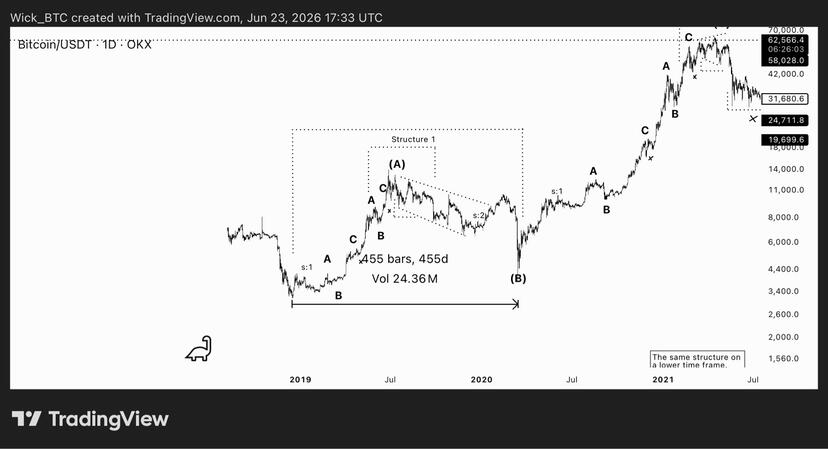
$BTC cycles inside cycles.Nobody seems to have noticed this, but in the 2018–2020 period (Structure 1), which I recently highlighted in my previous post, Bitcoin completed both a bull and a bear cycle in just 455 days — a little over one year.What makes this interesting is that this entire cycle occurred inside the larger 4-year cycle that most people focus on. Many dismissed it as a random event caused by COVID, but I believe the market had already priced in what was going to happen. The catalyst may have accelerated the move, but the structure was already there.So what does this mean?It suggests that the 4-year cycle is not the only cycle at play. There are smaller cycles nested within larger ones, each influencing price action on different timeframes.And if that’s true, then the 4-year cycle itself may simply be a smaller component of an even larger cycle — one that could span roughly 10 years or more.Markets are fractal. The same patterns repeat across different scales. The key is recognizing which cycle you’re currently trading within.
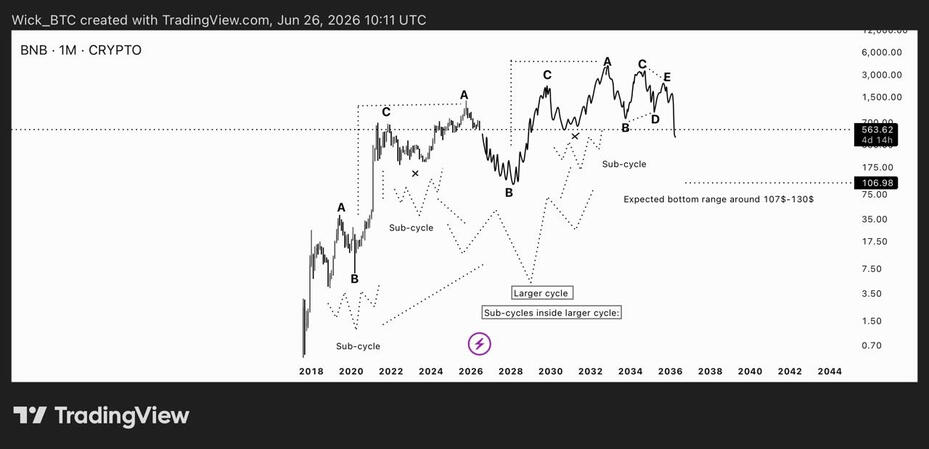
$BNB HTF update:My current thesis on BNB:
I believe BNB is not just moving in simple 4-year market cycles. Instead, it appears to be trading inside a much larger macro cycle, likely lasting 10+ years.Most likely, the commonly discussed 4-year cycle is itself just a sub-cycle inside this much larger structure. What many perceive as complete bull and bear cycles may actually be smaller waves forming within one massive macro pattern.Within this larger structure, multiple sub-cycles (A-B-C corrections and recoveries) have already formed. But when zooming out, these sub-cycles may simply be parts of one major cycle.If this larger cycle thesis is correct, BNB may now be approaching a major reset of the entire macro structure, with the expected bottom range around $107–$130.In short:
Small cycles inside big cycles.
Even the 4-year cycle may only be one component of a much larger macro cycle, which may now be nearing its reset phase.
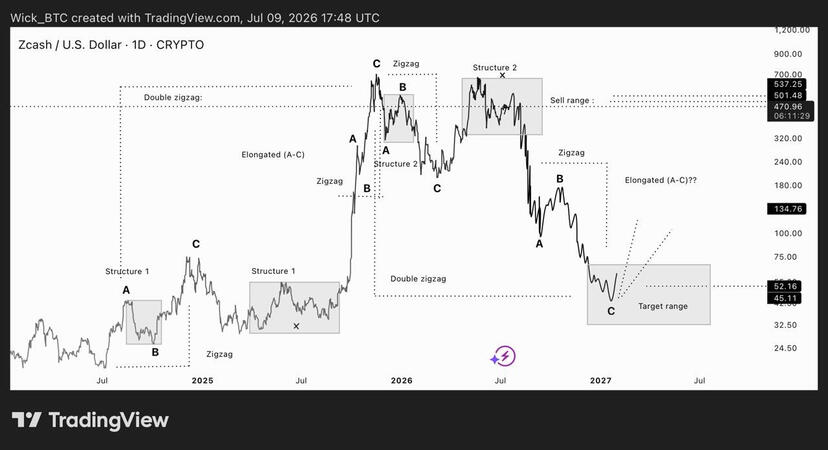
$ZEC. HTF update:It looks like price is forming the exact same pattern that appeared during the rally from $15 to $775.The interesting part is that it’s now repeating the same sequence in reverse. If you look closely, the structure is almost identical—I’ve carefully highlighted each matching section with the boxes.If this fractal continues to play out, the current target zone remains around $45–50 before the next major move.
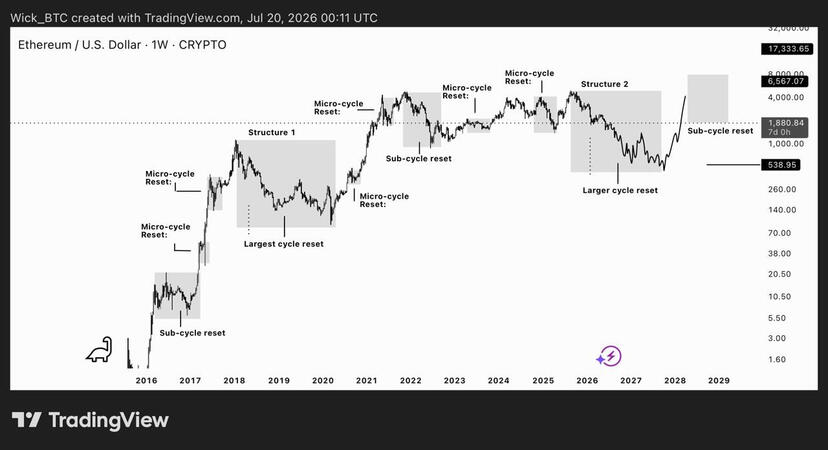
$ETH HTF update:While everyone thinks the market moves in just one cycle, the reality is very different.The market is built on multiple layers of cycles.A larger cycle contains several sub-cycles, and each sub-cycle is made up of multiple micro-cycles. This fractal structure repeats across every timeframe—from the yearly chart all the way down to the 1-minute chart.Based on my analysis, the current bearish phase is expected to become the reset of the larger cycle, suggesting that a deeper correction could still lie ahead before the next major expansion begins.My long-term target for Ethereum remains in the $500–600 range, where I expect the larger cycle reset to complete before a new bullish cycle begins.